Script to generate the map available here
Map data from OpenStreetMap
Powered by Geoapify
Alberto Marnetto's Notebook

Before Corona I used to have a car, to travel to Cologne frequently for some Brazilian dance party, to dislike paying for parking and to like maps. The pandemic freed me of many of these inconvenient habits, allowing me to spend more time at home in front of a screen instead of wasting time staying outside, exercising the body, having fun and making friends.
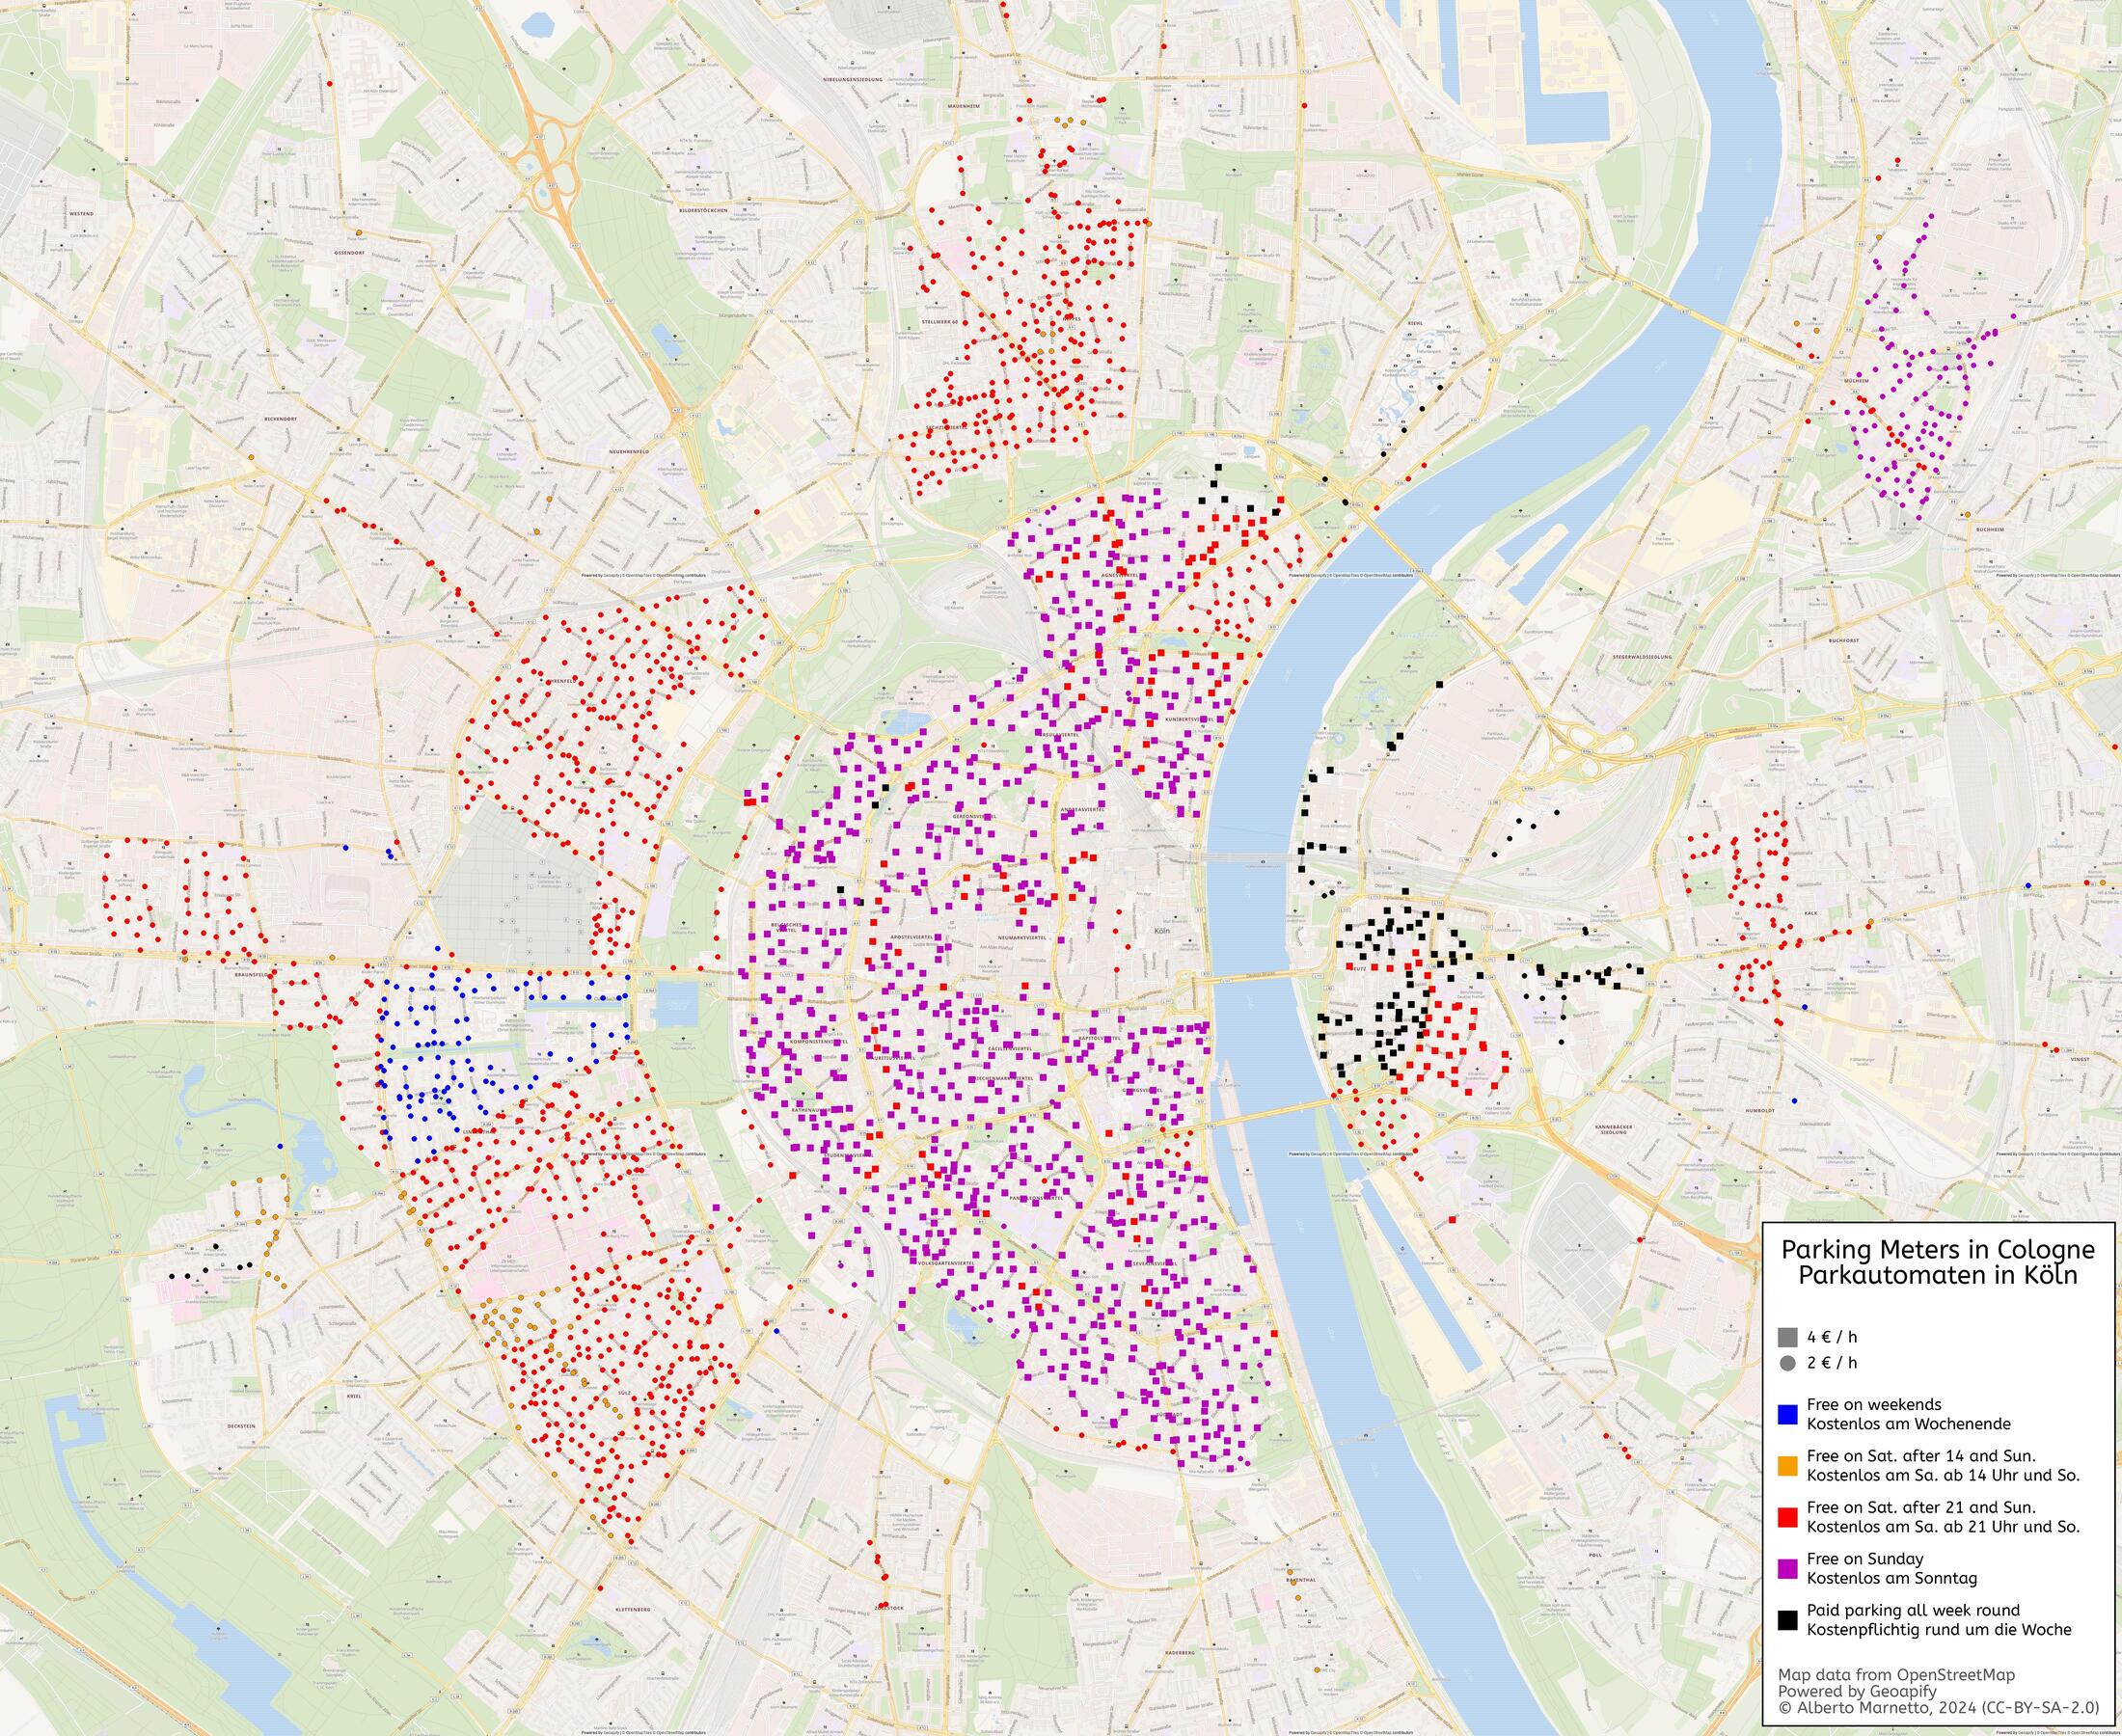
That said, my love for maps remains, and while doing some cleanup in my old files I rediscovered a small project I did some years ago, a map of the parking meters of the city of Cologne, which I created for my strategic attempts of saving a couple of euros while going downtown on Saturday evening. Why not publish an updated edition? Maybe a couple of people might find it useful, another couple may think it looks nice, and it’s a fun little project anyway.
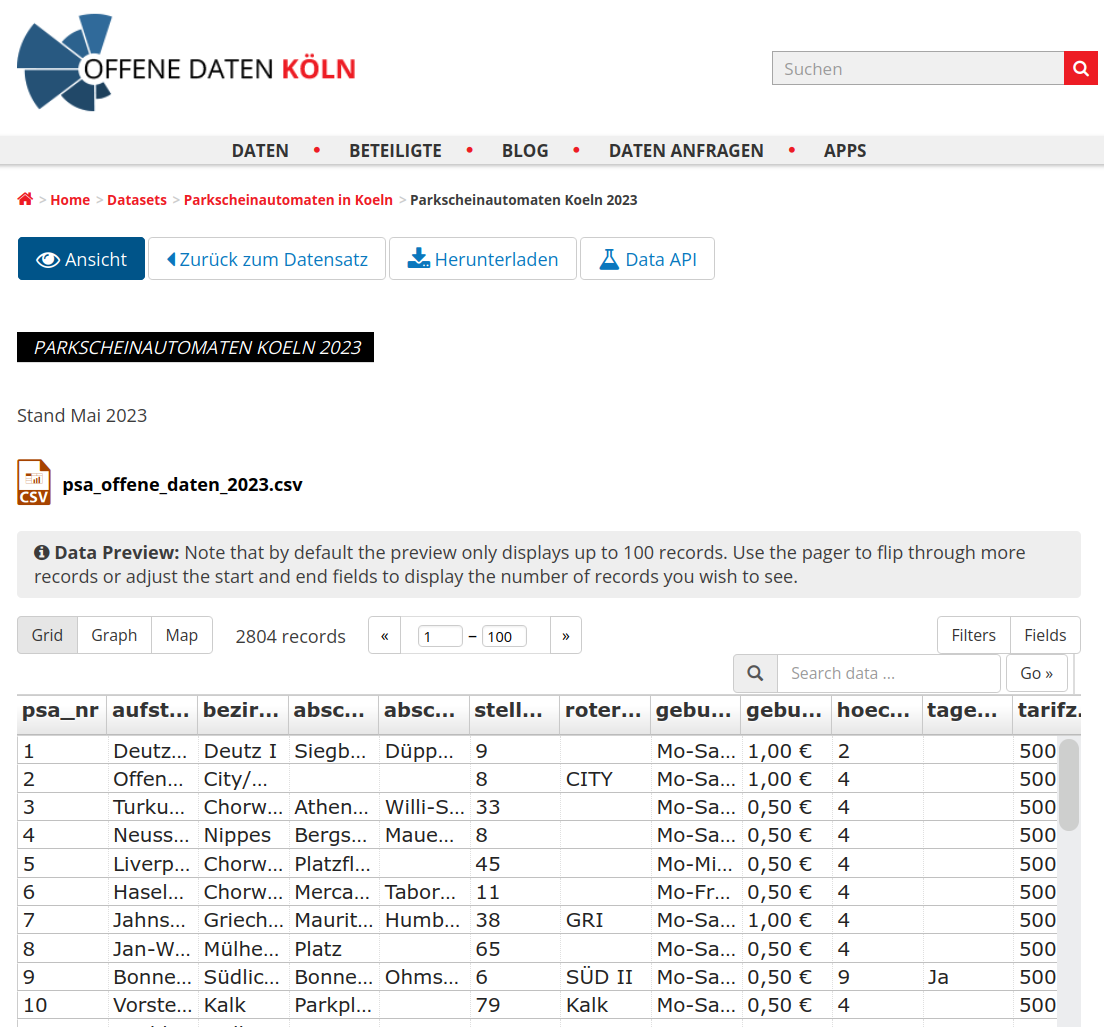
The city of Cologne does not publish a map of the parking zones, but it kindly supports an open data project with many interesting datasets. One of them lists all parking meters in the city, with their geographical coordinates as well as their activity times and prices.
The dataset is published every several years. At the time I took the 2018 edition, now the 2023 version seems to be the most up-to-date.

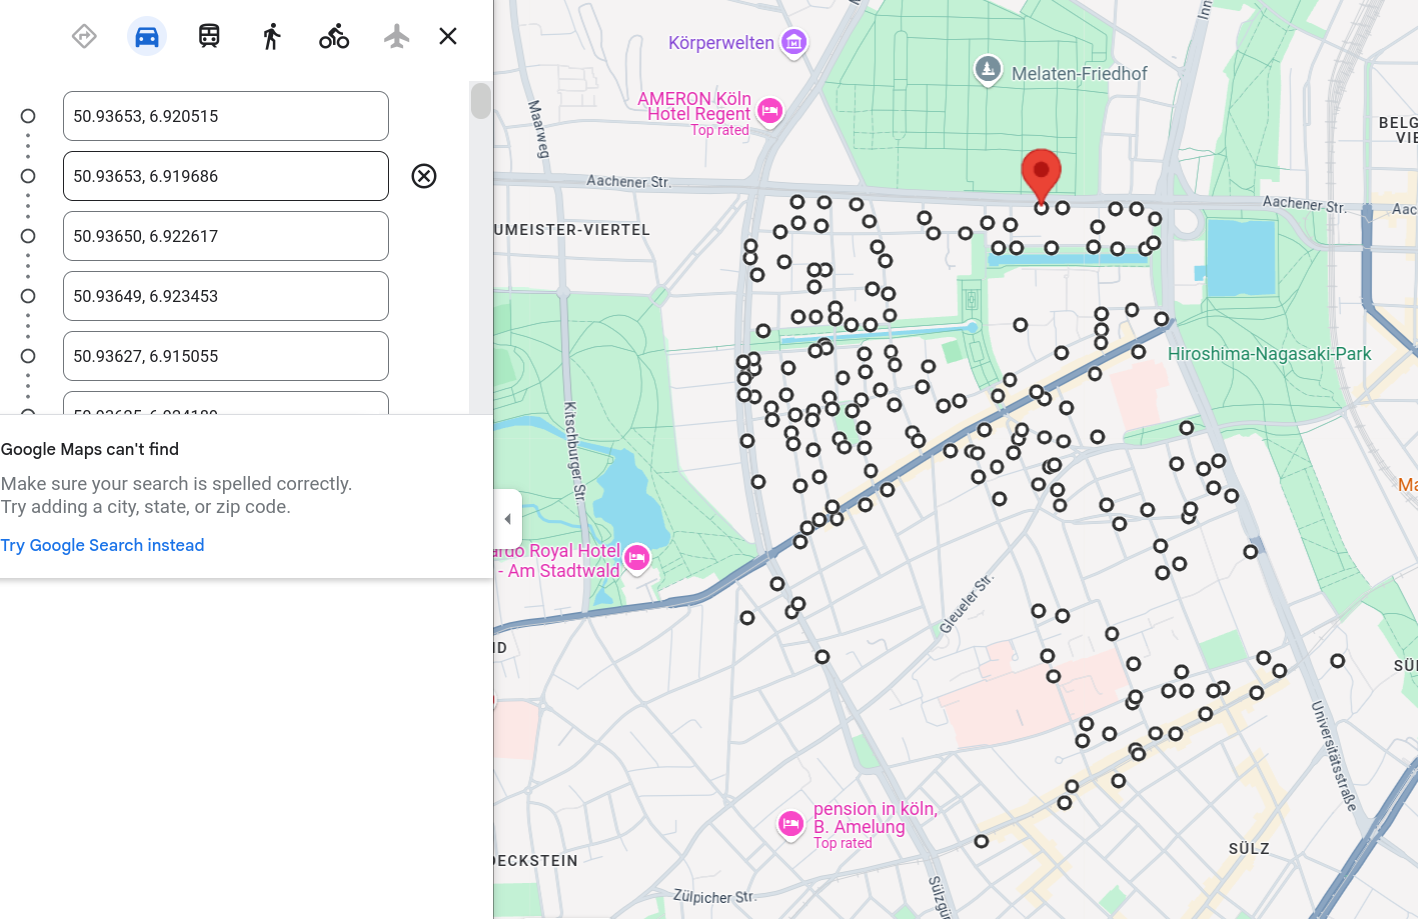
The dataset lists all the geographical coordinates of the parking meters. Now we only have to superimpose it on a map. I previously used a quick-and-dirty method for that, building a Google Maps URL containing the meters coordinates as marker. The feature seems to have been removed in the last years, but one can still use the waypoints as workaround. The main limitation is that the URL length is limited and one can put at most some hundred of markers there, way less than the 2700 that we need. We can still extract a subset and plot it; useful if one is willing to filter the entries, e.g. to only select a district.

If we want a full map and more flexibility, we need to do things properly:
For the first part, static maps can be found in many places. Google has Maps Static API and Microsoft has Bing Maps. However it is easier, and safer from the legal point of view, to use OpenStreetMap (OSM). There are lots of options to get static maps from the OSM database, I go with GeoApify.
The URL to get a static map is relatively straightforward:
https://maps.geoapify.com/v1/staticmap?style=osm-bright&width={map_pixel_size[0]}
&height={map_pixel_size[1]}¢er=lonlat:{map_center.lon},{map_center.lat}
&zoom={zoom}&apiKey={api_key}
Getting suitable sizes and zoom needs some attempts. GeoApify does not crop the requested map size to a max value (Bing supports 2000x1500 max), but it seems to timeout if the values are too big. At the end, I resort to download nine maps with 2200x1800 resolution in a 3x3 matrix, and collate them. The resulting image is 6600x5400, which is enough to cover almost the whole city of Cologne at my desired zoom size.
Converting the coordinates is not hard, one just needs to have a couple of formulas at hand. The first one is documented on StackExchange and Bing Maps, the others are basic geometry and algebra:
meter_per_pixel = 1. / 2 * 156543.03392 * cos(latitude_in_deg * pi / 180) / (2**(zoom))
meter_per_deg_northing = 6378137. * 2 * pi / 360
meter_per_deg_easting = 6378137. * 2 * pi / 360 * cos(latitude_in_deg * pi / 180)
deg_per_pixel_northing = meter_per_pixel / meter_per_deg_northing
deg_per_pixel_easting = meter_per_pixel / meter_per_deg_easting
The rest follows quite easily. Copilot, which wasn’t of much help in my previous project, this time is quite helpful in showing me how to plot the markers on the map using the Pillow library.
I can encode some extra information using color and shape of the markers, so I use shape/size to distinguish the expensive parking zones from the very expensive ones, and the color to give some indication about the free parking times. There are not less than forty-nine different time indications:
$ cat psa_offene_daten_2023.csv | awk -F';' '{ print $8 }' | sort | uniq | wc -l

49

At the end, in the spirit of my weekend trips, I decide to show in which times of the weekend one can park for free, to help the partygoers to better plan their trip.
That, my reader, I leave to you. My own main takeaway is that the section of Luxemburgerstraße just outside the railroad bridge seems still to offer free parking. I do not need this information anymore, but it saved me some pennies when I went dancing to Tanzraum in Barbarossaplatz. Hope you can also get some useful info. In any case, see you next time!
P.S. The source code to generate the map is available in this repository